Final Project Report
Overview
The final project report is your opportunity to document the complete CookYourBooks application your team has built. You'll create a written report covering your architecture decisions, team collaboration, and lessons learned, along with an infographic poster that visually showcases your work.
The final report is worth 50 points and serves as the capstone submission for the group project. Infographics will be compiled into a gallery for peer learning across teams.
Due: Monday, April 20, 2026 at 11:59 PM Boston Time
The final report is something you should work on throughout the group project, not just in the last few days. Architecture decisions, team reflections, and "Our Feature" design work happen during GA1 and GA2 — capture them as you go. The Apr 20 deadline gives you a few extra days after the GA2 checkpoint (Apr 16) to finalize and polish, but this is not meant to be written from scratch in that window.
Deliverables
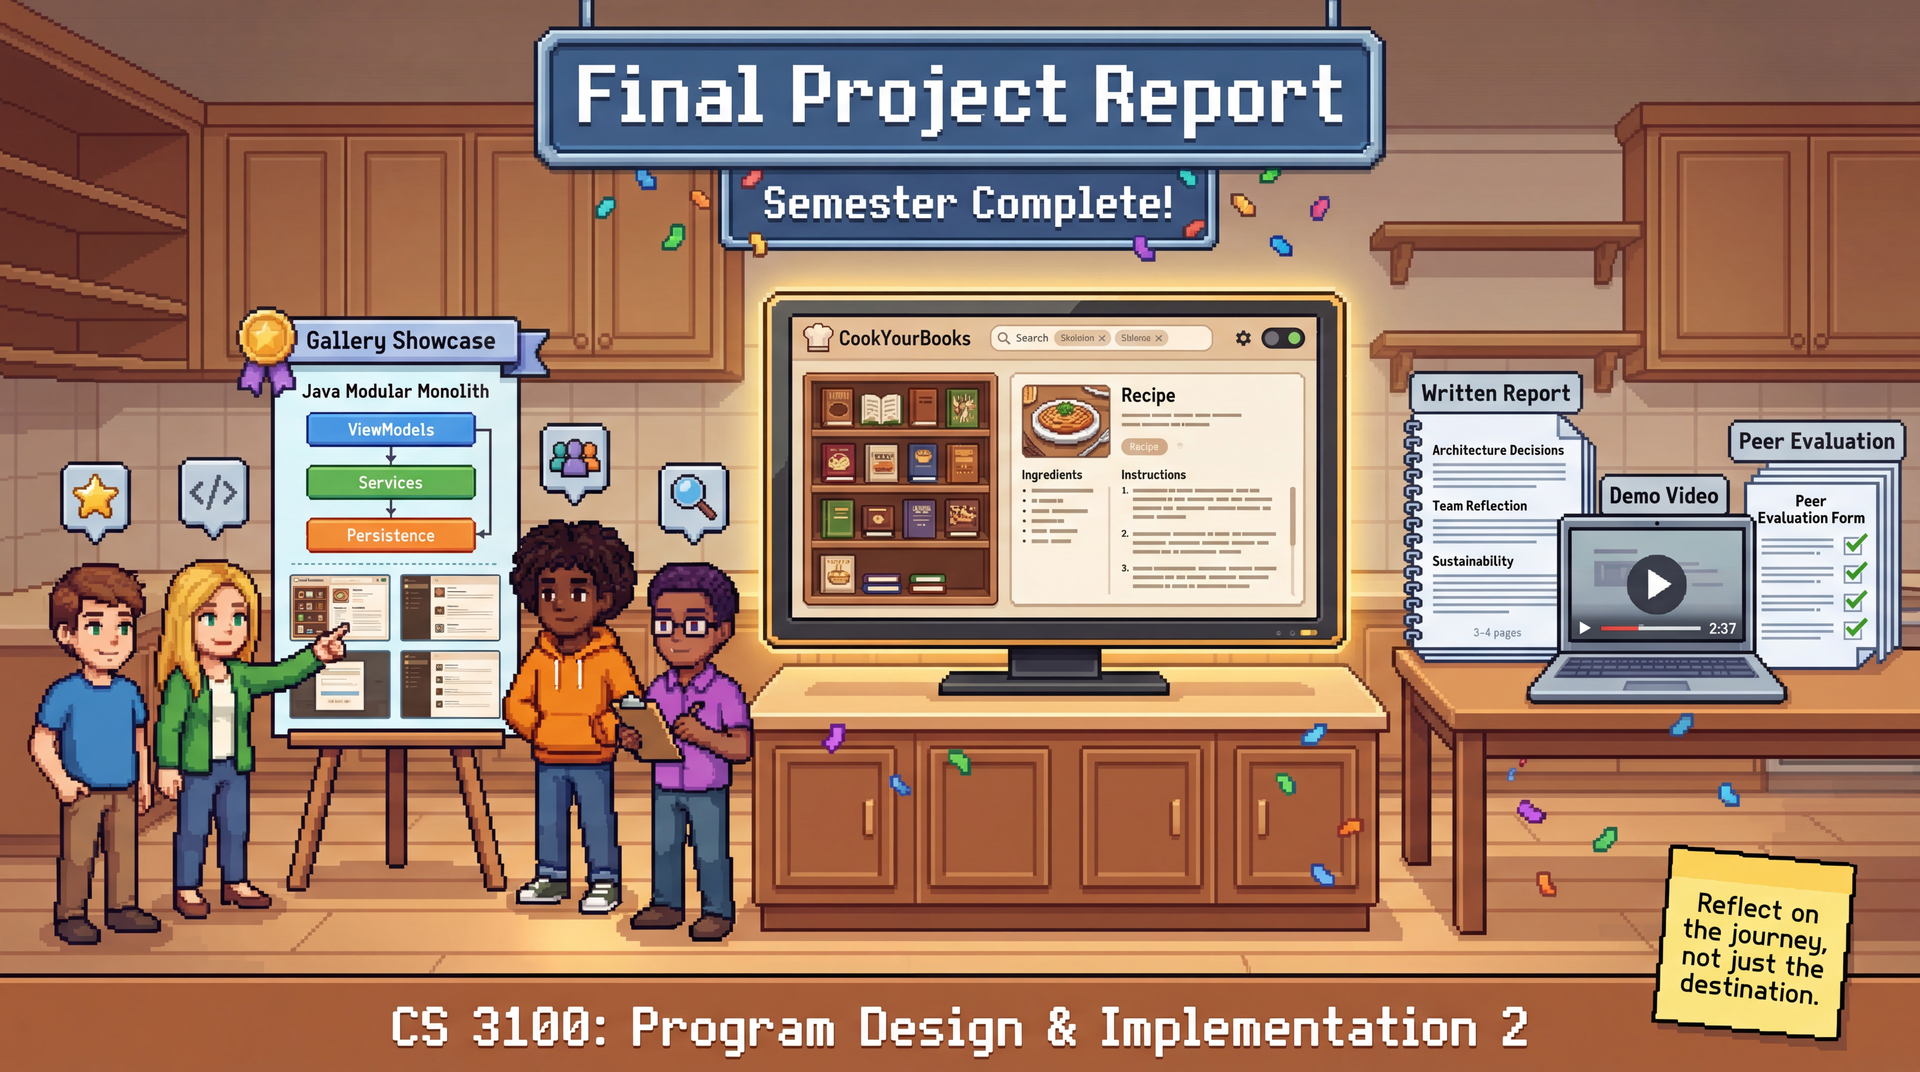
1. Written Report (3-4 pages)
Your team submits a single written report (PDF) containing the following sections:
Project Summary (1/2 page)
- What you built: List all core features and Feature Buffet selections implemented
- Key accomplishments: What are you most proud of?
- Application overview: Brief description of the user experience
Architecture Highlights (1 page)
Present 2-3 key architectural decisions your team made:
For each decision, include:
- The problem you were solving
- Alternatives you considered
- Why you chose your approach
- A brief diagram or code snippet illustrating the decision
Possible topics:
- How MVVM enabled testability and individual accountability
- How you integrated the Gemini API for recipe import
- How you handled async operations and UI updates
- How your team's UI terminology and naming conventions evolved during development
- A refactoring that improved code quality
"Our Feature" Design Concept (1 page)
Present the custom feature your team designed in GA0—the one you didn't implement:
- What user need does it address?
- Show your wireframes/design concept
- Brief technical considerations
- Why you chose not to build it (honest assessment of scope/complexity)
This demonstrates your ability to think beyond implementation to product vision. Great "Our Feature" sections show creative thinking constrained by realistic engineering judgment.
Team Reflection (1/2-1 page)
Honest reflection on collaboration:
- What worked well in your team process?
- What would you do differently?
- One thing each team member learned from this experience
- Advice for future students tackling this project
Sustainability Assessment (1/2-1 page)
As discussed in L36: Sustainability, software sustainability has four dimensions:
| Dimension | Consider |
|---|---|
| Technical | Is the code maintainable? What technical debt exists? |
| Economic | What would it cost to continue development? |
| Social | Does the app serve diverse users well? Accessibility status? |
| Environmental | Energy efficiency? Data storage implications? |
Address:
- Current state of your application across these dimensions (address all four; if a dimension is not applicable, explain why)
- Top 3 improvements you'd prioritize for a "v2.0"
- Potential risks if the application were deployed to real users
2. Infographic Poster (single landscape page)
Create a single-page visual summary of your project. This is your "elevator pitch" in visual form—something that could hang on a wall and communicate your project's essence at a glance.
Required elements:
- Application screenshots demonstrating key features
- High-level architecture diagram
- Team member names and primary contributions
- Key metrics (e.g., tests written, PRs merged, lines of code, features implemented)
Design tips:
- Use a landscape orientation (11x8.5" or A4 landscape)
- Prioritize visual clarity over text density
- Use consistent colors and typography
- Include your team name/number prominently
All infographics will be compiled into a gallery for asynchronous viewing by other teams and course staff.
3. Demo Video (2-3 minutes)
Record a brief screen capture demonstrating your application:
Suggested flow:
- Start with an empty or minimal library
- Import a recipe from an image (show Gemini API in action)
- Browse the library, search for something
- View and edit a recipe
- Demonstrate 1-2 of your Feature Buffet selections
- Show any unique or polished aspects of your UI
Tips:
- Use realistic recipe data (not "Test Recipe 1")
- Show both happy path and one error handling scenario
- Add brief narration or captions explaining what you're demonstrating
Public Showcase (Optional)
Teams may opt-in to have their infographic featured on a public showcase on the course website. This is entirely optional and does not impact your grade.
If you opt in:
- Your infographic will be displayed on the public course website
- Your team members' names will be visible
- You're giving permission for the work to be shared publicly
This is a great opportunity to build your portfolio and share your work with future students, employers, or anyone interested in the course.
To opt in: Include a statement in your report submission: "We consent to having our infographic displayed on the public course showcase."
Grading Rubric
Total: 50 points. The individual reflection is a mandatory submission gate (grades not released until submitted) but is not scored separately. These deliverables and point values apply equally to 3-person and 4-person teams.
Written Report (30 points)
| Section | Points | Excellent | Satisfactory | Needs Improvement |
|---|---|---|---|---|
| Project Summary | 4 | Complete feature list, clear application overview | Feature list present | Vague or missing |
| Architecture Highlights | 10 | 2-3 decisions with problem, alternatives, rationale, and diagram/snippet | Decisions described but thin on alternatives or rationale | Generic or missing architectural discussion |
| "Our Feature" Design Concept | 8 | Clear user need, wireframes, technical considerations, honest scope assessment | User need and design present | Superficial or missing |
| Team Reflection | 4 | Honest, specific, actionable; includes per-member learning | Present but generic | Absent or purely positive |
| Sustainability Assessment | 4 | All four dimensions addressed with specific observations and prioritized v2.0 improvements | Most dimensions covered | Cursory or missing |
| Total | 30 |
Infographic Poster (10 points)
| Criterion | Points | Excellent | Satisfactory | Needs Improvement |
|---|---|---|---|---|
| Required elements present | 5 | Screenshots, architecture diagram, team contributions, key metrics all included | Most elements present | Key elements missing |
| Clarity and design | 5 | Communicates project at a glance; clear visual hierarchy | Readable but cluttered or dense | Difficult to parse |
Demo Video (10 points)
| Criterion | Points | Excellent | Satisfactory | Needs Improvement |
|---|---|---|---|---|
| Coverage | 5 | Shows import, library, search, editor, and 1-2 buffet features; includes error handling | Core flow shown; some features skipped | Minimal coverage |
| Clarity | 5 | Narrated or captioned; realistic data; easy to follow | Followable but unexplained gaps | Hard to follow; placeholder data |
Individual Accountability Adjustment
TA meeting observations, weekly collaboration surveys, and the peer evaluation survey (submitted with this final report) can adjust an individual's final grade by up to -20 points or award an upward adjustment of up to +20 points. The upward adjustment exists for a specific scenario: if your team's project isn't fully complete, but you went above and beyond to support struggling teammates, you can still earn full marks. This is not an extra credit mechanism; simply doing your own work well is the expected baseline.
Individual Reflection (submitted separately)
Each team member submits a personal reflection via Pawtograder. This is a mandatory gate: your individual and team grades for this assignment will not be released until your reflection is submitted. Write 1–2 paragraphs per question; be honest and specific—generic answers don't demonstrate growth.
1. Collaboration and Feedback
Describe a specific moment of collaboration during the group project—a code review, a design discussion, or a moment where you had to give or receive difficult feedback. What happened, and what did you learn from it? If collaboration was difficult at any point, reflect honestly on why and what you'd do differently.
2. Navigating Conflict and Change
Describe a moment when something didn't go according to plan: a disagreement with a teammate, a blocked technical approach, or a scope that proved too ambitious. How did you handle it? Do you think you made the right call, and why?
3. Working Across Perspectives
Your team members owned different features and brought different ideas and working styles. Describe a moment when someone else's perspective changed how you thought about your own work—or a moment when you wish you'd sought out a different perspective sooner.
4. Reflection and Growth
Looking back at the full semester: what's one professional or collaboration skill that this project pushed you to develop? What would you do differently in your next team project, and what concrete habit or practice would you carry forward?
5. Feedback on the Project
Give us specific, actionable feedback on the group project: what worked well and should be kept, and what should change? Think about the assignment structure, timeline, grading criteria, provided materials, or anything else. For each piece of feedback, explain the problem it solves and any tradeoffs—just like the feedback you'd want to receive on a code review.
Submission
Merge to main (team deliverables — automatically submitted to Pawtograder):
- Written Report (PDF, 3-4 pages)
- Infographic Poster (PDF or PNG, single landscape page)
- Demo Video (MP4 or link to unlisted YouTube/Vimeo)
- Public showcase opt-in (if desired, include statement in report)
Submit via Pawtograder (individual):
- Peer Evaluation Survey (rate each teammate's contributions and collaboration)
- Individual Reflection (answers to the 5 questions above)
Checklist
- Written report includes all 5 sections: Project Summary, Architecture Highlights, "Our Feature" Design Concept, Team Reflection, Sustainability Assessment
- Infographic is single landscape page with required elements
- Demo video is 2-3 minutes showing key functionality
- All team members contributed to and reviewed the deliverables
- Peer evaluation survey submitted by each team member via Pawtograder
- Individual reflection submitted separately by each team member